
Learning target:
We have a short class today because of the PEAK meeting. We'll use the first third of the class to follow up on yesterday. And then the rest of the time we'll get on the floor making some maps. Curious? Read on.
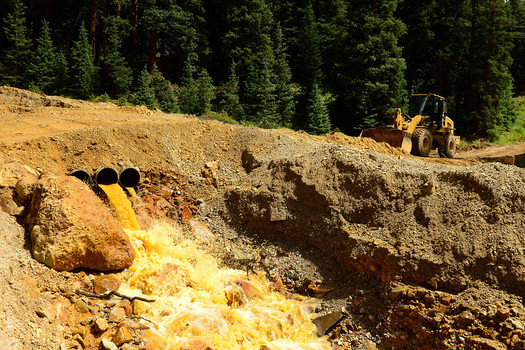
1. Starter - 1872 Mining Law
I want you to read this op-ed on the 1872 from the director of the organization that I mentioned yesterday, Earthworks. What kind of story is she telling in this article? What metaphor is she using? Which of the numbers to you seem most relevant? We'll discuss as a quick review of yesterday.
2. Which Numbers are Most Important
I've uploaded into this spreadsheet all the numbers about the river that we've picked out together as a class and that you picked out individually on your articles over the weekend. Which of these are most important? I'll have you vote for three to five that you feel are most important to the problem we're trying to solve. We'll see which get the most votes and talk about what story these numbers suggest or reinforce and what solutions they point us toward.
3. Mapping Causes
Okay, I'm going to give you a bunch of individuals, groups, and entities that have potentially contributed to the situation in the river. In four different groups, you'll make a map showing how these different factors connect to each other. This will take most of the rest of the period. We'll use last night's homework to break down your maps. Before the end of the period, each group will join forces with another and merge their maps into one. A little bit of consensus practice here to make this happen. We're going to be building toward a single causal story we can all agree with on Thursday.
Homework due Thursday, October 1st
Read this handout on Interests and come ready to jam in discussion on Thursday
- We can connect numbers to political stories
- We can breakdown and explain a problem using direct and indirect causes
We have a short class today because of the PEAK meeting. We'll use the first third of the class to follow up on yesterday. And then the rest of the time we'll get on the floor making some maps. Curious? Read on.
1. Starter - 1872 Mining Law
I want you to read this op-ed on the 1872 from the director of the organization that I mentioned yesterday, Earthworks. What kind of story is she telling in this article? What metaphor is she using? Which of the numbers to you seem most relevant? We'll discuss as a quick review of yesterday.
2. Which Numbers are Most Important
I've uploaded into this spreadsheet all the numbers about the river that we've picked out together as a class and that you picked out individually on your articles over the weekend. Which of these are most important? I'll have you vote for three to five that you feel are most important to the problem we're trying to solve. We'll see which get the most votes and talk about what story these numbers suggest or reinforce and what solutions they point us toward.
3. Mapping Causes
Okay, I'm going to give you a bunch of individuals, groups, and entities that have potentially contributed to the situation in the river. In four different groups, you'll make a map showing how these different factors connect to each other. This will take most of the rest of the period. We'll use last night's homework to break down your maps. Before the end of the period, each group will join forces with another and merge their maps into one. A little bit of consensus practice here to make this happen. We're going to be building toward a single causal story we can all agree with on Thursday.
Homework due Thursday, October 1st
Read this handout on Interests and come ready to jam in discussion on Thursday


 RSS Feed
